
Making ML Ops observable and explainable: serving, hosting and monitoring combined.
Maximizing performance and minimizing risk are at the heart of model monitoring. In mission-critical AI models, real-time visibility is crucial. Respond quickly by retraining your model, replacing the current version or tweaking the pipelines. Additionally, setting up your serving and hosting infrastructure in a scalable way can be time consuming and complex. For these reasons, Arthur and UbiOps are pleased to announce an exciting integration that brings best-in-class tooling for model serving and model monitoring.
UbiOps is the easy-to-use serving and hosting layer for data science code. UbiOps makes it easier than ever to use a top-notch deployment, serving, and management layer on top of your preferred infrastructure. Accessible via the UI, client library, or CLI, it’s suitable for every type of data scientist, without the need for in-depth engineering knowledge.
Arthur is the proactive model monitoring platform that gives organizations the confidence and peace of mind that their AI deployments are performing at peak. Arthur provides a layer of performance monitoring, algorithmic bias detection, and explainability, even for black box models, so data science teams can detect, diagnose, and fix any issues in production.
Together, Arthur and UbiOps provide a powerful set of tools that give you complete control over your production AI. This blog post will demonstrate just how easy it is to get started with the Arthur and Ubiops integration, so you can complete your AI stack and stay in control.
1. Use case description
With the recent increases in house prices across the world, a model to predict what the price of a specific house would be could come in handy. But how can we keep track of the model’s performance, and how can we explain why one house may be priced higher than another?
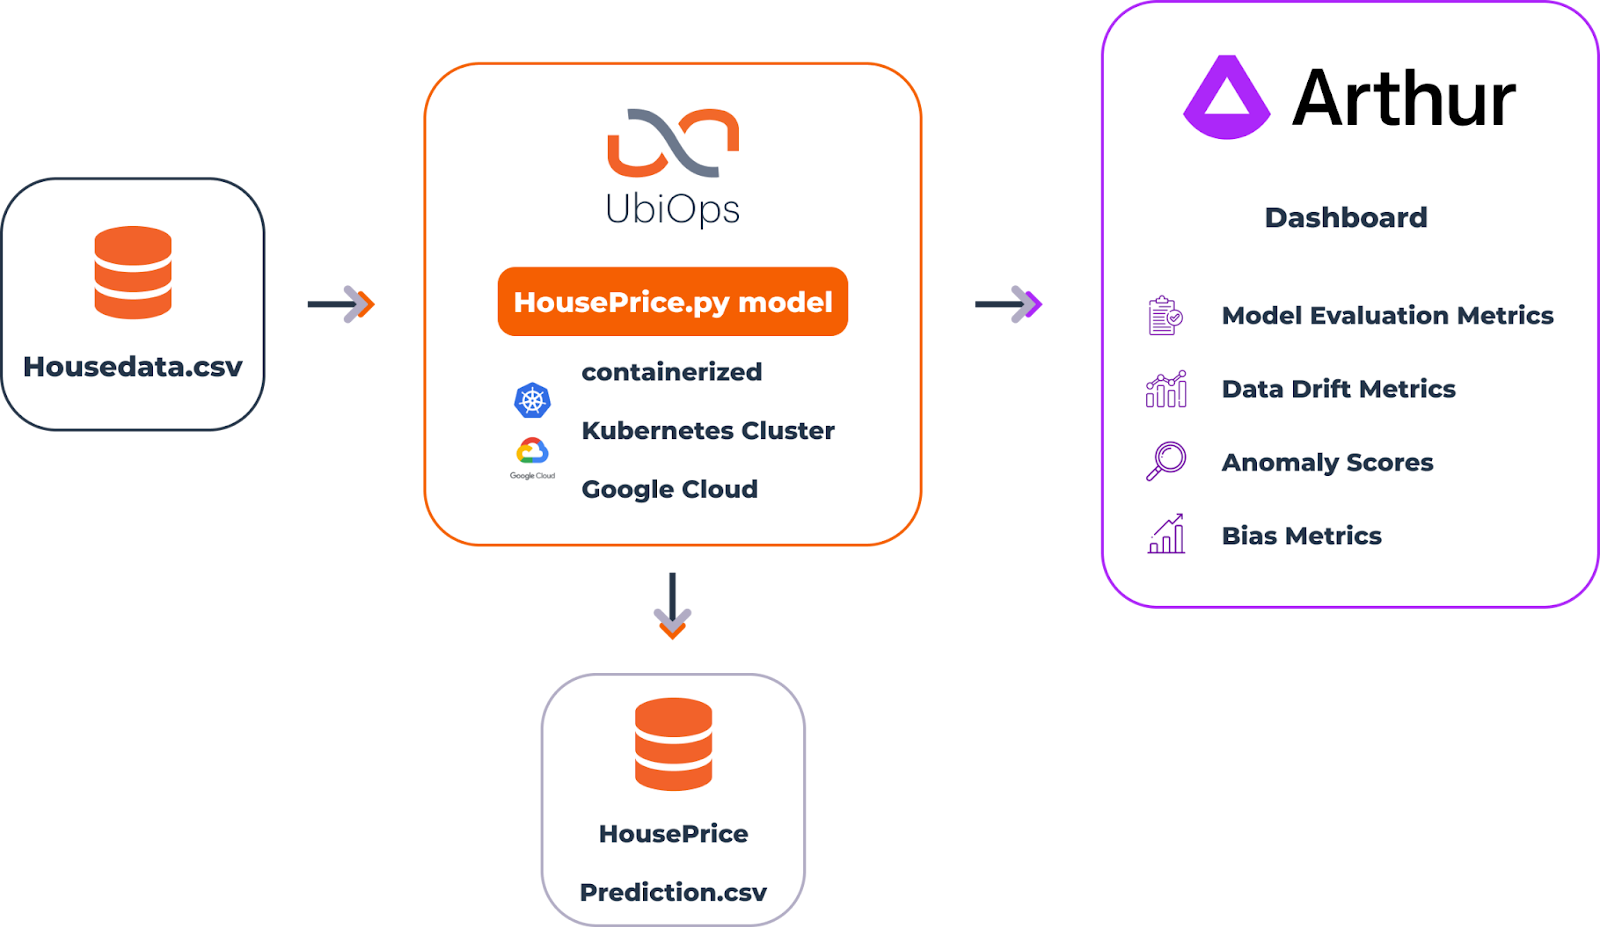
Using a publicly available dataset from King County, USA, we trained a xgboost model to predict the house prices in that region. Using the UbiOps CLI, the model is easily containerised, deployed on a Kubernetes pod, and served behind an automatic API endpoint. Via the API, Arthur picks up the model’s inputs and predictions and calculates data drift, model stability, and explanations.
2. Notebook walkthrough and instructions
This Notebook is based on the Xgboost recipe from the UbiOps cookbook. Please check out the full notebook for everything you need to set this up. Compared to the Xgboost recipe there are 2 big differences.
The first adjustment is the following: we need to register the (pre-trained) model to the Arthur platform. We do that using the following code snippets:
from arthurai import ArthurAI

from arthurai.common.constants import Stage, InputType, OutputType, ValueType

ARTHUR_URL = "https://app.arthur.ai"

ARTHUR_ACCESS_KEY = "<YOUR ARTHUR API KEY>" # Fill this in

connection = ArthurAI(url=ARTHUR_URL, access_key=ARTHUR_ACCESS_KEY)

# Define the model schema

arthur_model = connection.model(partner_model_id="UbiOps House Prices",

                                input_type=InputType.Tabular,

                                output_type=OutputType.Regression,

                                is_batch=True)

arthur_model.from_dataframe(train_data[input_columns], Stage.ModelPipelineInput)

arthur_model.add_regression_output_attributes({"price": "price_gt"}, value_type=ValueType.Float)

arthur_model.review()
The dataframe above represents how the model will look to Arthur, and the format of the data it will expect. Notice how it detected some columns as categorical (such as Waterfront and View).
Now we can save the model to Arthur, and store the Arthur Model ID to be used by our deployment
arthur_model_id = arthur_model.save()

with open("xgboost-deployment/arthur-model-id.txt", 'w') as f:

    f.write(arthur_model_id)
Then, we’ll upload the data we used to train the model as a reference set. Future data sent to the model will be compared to this reference set, to measure how much it has drifted from the types of inputs the model was built from.
ref_df = train_data[['price'] + input_columns].rename(columns={'price': 'price_gt'})

ref_df['price'] = xgb.predict(ref_df[input_columns].to_numpy())

ref_df

arthur_model.set_reference_data(data=ref_df)
The second addition is sending the inference data from within a deployment to the Arthur platform. You can see it in a snippet from the actual deployment file below (again look at our full notebook for the complete code). It is as simple as using the `send_inference` method of the Arthur client library.
    def request(self, data):

        """

        Method for deployment requests, called separately for each individual request.

        :param dict/str data: request input data. In case of deployments with structured data, a Python dictionary

            with as keys the input fields as defined upon deployment creation via the platform. In case of a deployment

            with plain input, it is a string.

        :return dict/str: request output. In case of deployments with structured output data, a Python dictionary

            with as keys the output fields as defined upon deployment creation via the platform. In case of a deployment

            with plain output, it is a string. In this example, a dictionary with the key: output.


        """

        print('Loading data')

        batch = pd.read_csv(data['data']).astype({'id': str})

        batch_id = str(uuid4()).split('-')[-1]

        print("Predictions being made")

        batch['price'] = self.model.predict(batch.drop(columns=['id']).to_numpy())

        print("Sending batch to Arthur")

        inference_data = [{'inference_timestamp': datetime.datetime.now(pytz.utc),

                           'partner_inference_id': row['id'],

                           'batch_id': batch_id,

                           'inference_data': {k: row[k] for k in row.keys() if k != 'id'}}

                           for row in batch.to_dict(orient='records')]

        self.arthur_model.send_inferences(inference_data)
Now the Arthur platform can compare training data to actual inferences.
You can explore the data in Data Explorer and view drift metrics for the input and output variables, as well as accuracy metrics such as Root Mean Square Error (RMSE).
3. Wrap up
Now that you’ve seen how UbiOps and Arthur.ai integrate to make serving, hosting and monitoring easily accessible, we hope that this helps you in your day-to-day projects. For any questions or suggestions and the latest product updates please join the UbiOps community slack channel and the Arthur slack community.
Download the full notebook here.


