(2020 version)
In a previous article I explained how to deploy a single data science deployment onto UbiOps that could be used for object recognition. However, in the real world, it is often not that simple. In reality, you usually don’t have a single model with perfect input and output. Rather, there is a chain of operations to get from the input to your desired output, for example, data collection, data cleaning, model inference and data storage. With modularity in mind, all of these operations can be seen as different steps. Discretizing your workflow in separate steps allows for benefits like reusability, scalability and transparency. At UbiOps we have integrated pipelines in the heart of our system, getting the mentioned benefits without any hassle.
In this tutorial, you will:
- Create a data pipeline
- Create a request to this data pipeline
Requirements
- Basic Python knowledge
- A working Python 3.7 installation
- Free account on UbiOps
- Knowledge on creating deployments in UbiOps
Business case and solution
Let’s use a fake business use case as a starting point for this data pipeline.
You work for a company that has a lot of customers. Every week your boss gives you a list of customer names and the task to identify the customer with the best profile and create some visualization for that. However, because customer data is a bit boring, let’s imagine you are actually dealing with Pokémon and instead of getting the best customer you have to find the Pokémon with the best stats.
Based on this we could define the following steps of our data pipeline:
- Import the list of Pokémon to analyse and match them to their stats
- Order the Pokémon to a certain metric
- Create a visualization
We can make these steps into separate deployments in UbiOps and add them to a pipeline. Now when your boss comes with this list you simply have to feed it into the pipeline and your work is done!
But why would you want to put it in separate steps and not simply in one monolithic program? Well like I said reusability, scalability and transparency are very important. But that’s very hard to achieve when everything is one big blob of code. For example how are you going to reuse a small part of a codebase easily if it’s all integrated into one big codebase? When dealing with reusability, scalability and transparency it’s easier and better to clearly separate functionalities.
The deployments
I have already created the deployments for you, let’s walk through them.
Pokémon matcher
I found a dataset on Kaggle that has statistics for every Pokémon, which we can use to match names to statistics. When dealing with customers instead of Pokémon this would be replaced by for example your CRM.
In this deployment we do the following steps
- Read the input Pokémon(i.e. the list our boss send us)
- Read our file with all the Pokémon stats
- Select only the Pokémon we got as input
- Export this selection to a CSV file
This way our deployment has the following input/outputs:
“input_pokemon: array of strings”
-> List of Pokémon from our boss.
“output_pokemon: file”
-> List of Pokémon from our boss with accompanying stats in a CSV format.
Pokémon sorter
We need to sort these Pokémon based on the best stats, we can start with the CSV from the Pokémon matcher step.
In this deployment we perform the following steps
- Read the input CSV(from the matcher step)
- Sort them based on their stats(higher is better)
- Export this as a CSV file
This way our deployment has the following input/outputs:
“input_pokemon: file”
List of Pokémon from our boss with accompanying stats in a CSV format.
“output_pokemon: file”
Sorted list of Pokémon from our boss with accompanying stats in a CSV format
Pokémon visualization
Our boss wanted a nice visualization of the results right? I found a great code snippet online for creating Pokémon stat visualizations, just like I remember seeing them on my old “Gameboy color”.

It is not really important to understand what’s happening in this visualization code, just that we can visualize the Pokémon we got from our previous step by doing this:
pokemon = pd.read_csv(data.get("input_pokemon"))
df_plot = pokemon
We then remove the line that makes the visualization appear on your screen:
plt.show()
With a function that saves it to a pdf:
plt.savefig('pokemon.pdf')
This way our deployment has the following input/outputs:
“input_pokemon: file”
-> Sorted list of Pokemon from our boss with accompanying stats in a CSV format
“output_pokemon: file”
-> Visualization of the selected pokemon in a PDF format
The Pokemon pipeline
You may have already noticed that every output is the same as the input of the next deployment. I have done this to easily make a pipeline of these separate deployments.
Visually the pipeline looks like this:
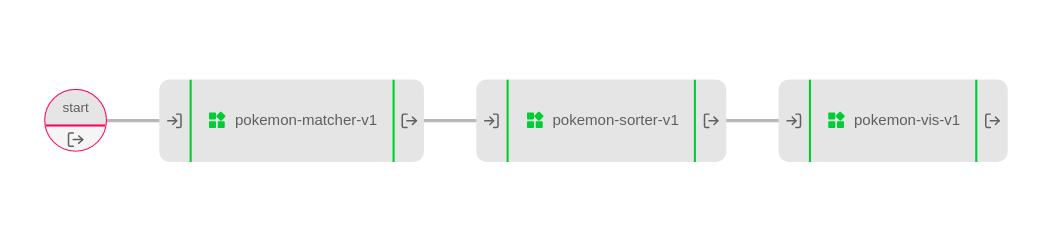
It’s quite easy to create this pipeline. Simply create a pipeline and add all three deployments to it. Then drag lines from each deployment to the next, until you have a graph like the one above. For more information about pipelines you can take a look at our documentation page.
You can test the pipeline by making a “direct request”
Try it out and see how your favourite Pokémon compares!
Wrapping up
After following these steps you should have a data pipeline that can match, sort, and visualize a list of Pokémon names. Your boss will be very happy. Hopefully, it is now also clear why a data pipeline made of separate deployments can be beneficial for you.
For example, if the next project of your boss is to find the Pokémon that have similar stats, given a list of Pokémon names. You can then reuse the first and last deployment in a new Pipeline! That means that you do not have to write code again and there are less separate systems that are doing the same thing without sharing computer resources.


