
 Introduction of use case
Visualising your data is a great way to bring the right message across to your audience. Until now, data processing scripts or low-code functionality enabled BI analysts to transform the data and filter out only the most important data. At the same time, many BI analysts are pumping up their python (or R) knowledge to apply more advanced analytics to their data and visualise that in a dashboard or low-code app. However, current BI platforms often don’t allow serving and hosting of python, and are especially not suitable to host machine learning code. A solution could be to use one of the major cloud providers, but requires specialized knowledge of a variety of services and is often easier said than done. In this example, we want to predict if a new Spotify song fits better with one of the two target audiences: Wouter or Alexander. The Spotify playlists of Wouter and Alexander are used to identify the music interests of the two target audiences. Alexander has developed a classification model that predicts if a song either belongs to Wouter’s Spotify list or that of Alexander. The model is deployed on Kubernetes with an API endpoint (in UbiOps) and visualised using Tableau.UbiOps & Rockfeather
Rockfeather uses Data Visualization, Data Science, and Low-Code technology to build smart solutions. Rockfeather creates best-in-class solutions for various industries and functions. That is how Rockfeather embraces technology and empowers ambitious people. UbiOps is a deployment tool built for data scientists and it allows them to deploy their code easily, with just knowledge of python or R.How does it work?
The first step in the process is about training a predictive model, which is able to find patterns in the data from the two target audiences. Once the model can find these patterns, it can be used to predict if a newly added song on Spotify is more interesting for Alexander or for Wouter. In order to do so, Alexander trained multiple machine learning models in a jupyter notebook using Spotify playlists data, of both his own account and that of Wouter. A trained model followed from that. After comparing different models’ performance with different parameter settings, we were satisfied with the performance of the trained model, the model is saved as “rf_saved.pkl”. This stores the model parameters and model weights, so that we can apply the model to any new data that we feed it.Then, we prepared the “deployment_package” to upload it to UbiOps. This package includes the following elements:
- Deployment.py (this is a file that contains code which instructs UbiOps how to initialize and use your deployment for inference).
- Requirements.txt (this states all the libraries your model requires, such as pandas, numpy, joblib and pycaret in our case).
- your model.py (python file with your trained model, in our case we call it ‘rf_saved.pkl’).
- UbiOps.yaml (this is used to install requirements on OS level that our model needs).

Figure 1: contents of the deployment package
Deployment.py
In this file you instruct UbiOps what to do. First, you define the “init” (initialize) function. This contains anything that must be kept in memory or to set up connections, such as API connections to a datasource.
Additionally, we want to establish a connection to a database to write the results to whenever requests start coming in. We’ll use google sheets for it, as we don’t have a proper database (e.g. sql) available, and it’s also not important for the article.
def __init__(self, base_directory, context):
    rf_model = os.path.join(base_directory, "rf_saved")

        self.model = load_model(rf_model)

self.google_sheet = pygsheets.authorize(service_account_env_var='GOOGLE_CREDENTIALS')
# Set the spreadsheet_id from the environment variables
self.spreadsheet_id = os.environ['SPREADSHEET_ID']
Secondly, you define the “request” function, which is called separately for each single request you’re going to make to the recommendation model. Every prediction should be written to a google sheets that we use as a database.
 print('Loading data')

        input_data = pd.read_csv(data['input_csv'],sep=";")

        print("Prediction being made")

        prediction = predict_model(self.model, data = input_data)

        # Writing the prediction to a csv for further use

        print('Writing prediction to csv')

        pd.DataFrame(prediction).to_csv('spotify_predictions.csv')

        results = prediction
        print(results)
        # Append the values to the specified Google Sheet

        sheet = self.google_sheet.open_by_key(key=self.spreadsheet_id)

        # Open first worksheet of spreadsheet

        wk1 = sheet[0]
        # Values will be appended after the last non-filled row of the table without overwriting

        wk1.set_dataframe(df=results, start=(1,1))

                return {

            "spotify_predictions": 'spotify_predictions.csv'

        }
More information on the deployments and packages can be found here.
Deployment via UbiOps
This can be done in a variety of ways, such as via the CLI, client libraries or simply via the UI. Today we will show the highlights of deploying the model via the UI.
Step 1: Make an account on UbiOps.
Step 2: Download the deployment_package here.
Step 3: Create a new deployment in UbiOps and specify the following:
Input (structured)
Name: input_csv
Field type: blob (file)

Figure 2: defining the input of the deployment
Output (structured)
Name: spotify_predictions
Field type: blob (file)

Figure 3: defining the output of the deployment
And continue by clicking ‘next step’ at the bottom right.
Last but not least you should create 2 environment variables. These are variables that you can refer to in your code, but that you don’t have to specify in your code, because you do that in UbiOps. For example, this way I can share my code with you without giving away which google sheet I’m writing to and what my google credentials are.
Name them exactly as you name them in the code. So in this case: GOOGLE_CREDENTIALS and SPREADSHEET_ID and paste the value in the ‘value’ field 🙂
More info on creating your google credentials here: https://developers.google.com/workspace/guides/create-credentials
You need to find the json file that includes service user credentials.
Your spreadsheet ID you can find in the url of your google sheet document.

Figure 4: creating environment variables in UbiOps.
In the end this is how they show up:
Figure 5: overview of environment variables in UbiOps UI
Now click ‘create’ and the deployment should start building.
Step 4: Once the deployment has finished building and the status is ‘available’, you can make a request. So click on ‘create a direct request’ and upload (as a test) the ‘spotify_test.csv’ file (added to the deployment package).
After a few seconds, the a .csv should be returned with the predictions.

Figure 6: results
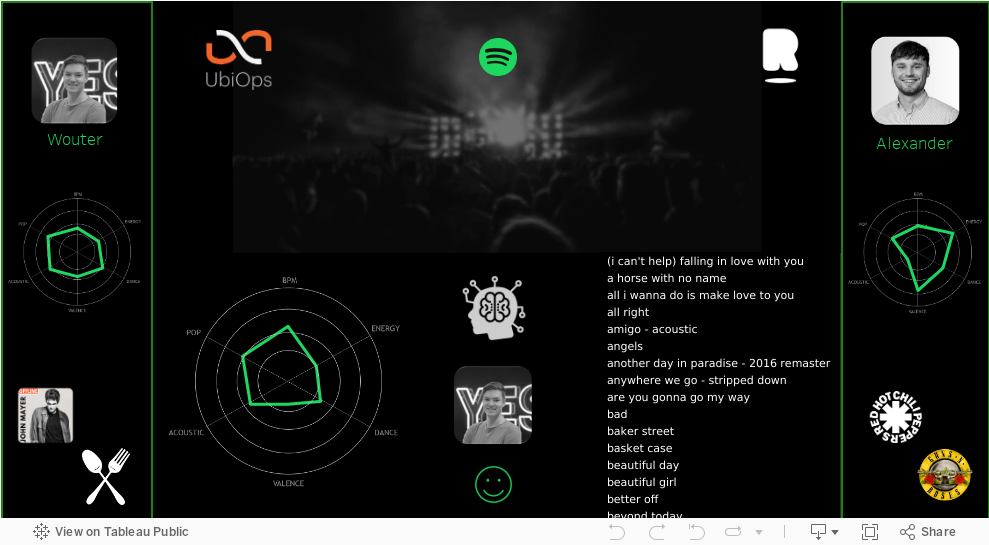
You can find the end result of how Alexander from Rockfeather visualised the test sheet in Tableau below.
In case you have any questions or remarks, feel free to join the UbiOps slack channel or send me an email via [email protected]. For Tableau related questions please contact Alexander Mik via [email protected]. We hope this helps you to run your data science code behind Tableau!


