Metrics
UbiOps generates metrics based on activity in the platform, and it is also possible to track your own custom metrics in UbiOps. This allows you to monitor the performance of deployments in production, or to investigate performance metrics during training runs.
The recommended way to access the metrics is through the WebApp (available at https://app.ubiops.com for our SaaS solution). However, it is also possible to access the metrics via the Python Client Library, the CLI and our API if you want to port them to your own dashboard.
Have a look at our Swagger page to see all available metrics endpoints.
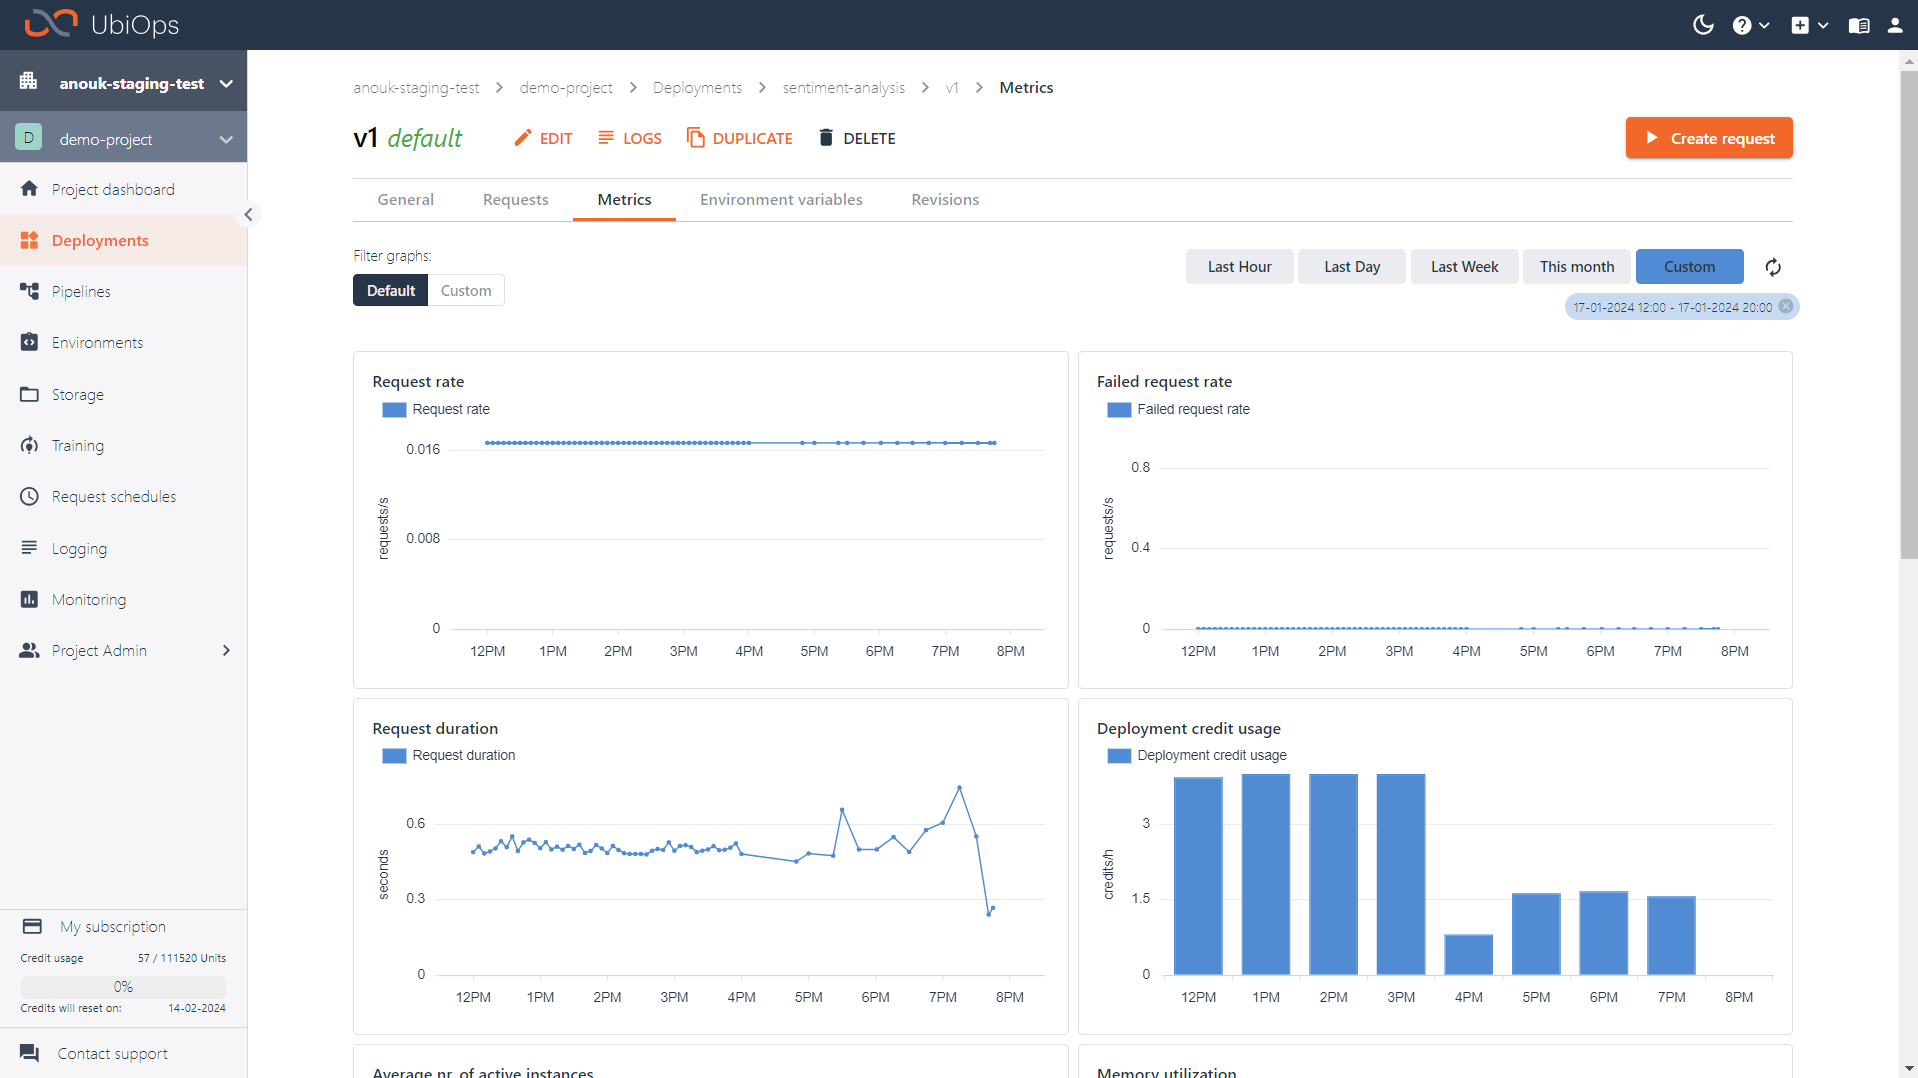
In the WebApp metrics can be found under Monitoring in the sidebar. By default, this will show an overview of project level metrics. It is possible to filter metrics on date, or to view metrics for specific objects.

Many objects in UbiOps (like deployment versions, pipeline versions and training runs) have a dedicated Metrics page as well. On these pages you can see all the metrics for that specific object.
The following metrics are available by default.
Default deployment metrics
| Metric[^1] | Unit | Description |
|---|---|---|
| deployments.credits | credits (float) | Usage of Credits [^2] |
| deployments.instances | instances (float) | Average number of active deployment instances |
| deployments.input_volume | bytes (int) | Volume of incoming data in bytes |
| deployments.output_volume | bytes (int) | Volume of outgoing data in bytes |
| deployments.request_duration | seconds (float) | Average time in seconds for a request to complete |
| deployments.memory_utilization | bytes (int) | Peak memory used during a request |
| deployments.requests | requests (int) | Number of requests made to the object |
| deployments.failed_requests | requests (int) | Number of failed requests made to the object |
| deployments.queue_size | items (int) | Average number of queued requests |
| deployments.queue_time[^3] | items (int) | Average time in seconds for a request to start processing |
| deployments.network_in | bytes (int) | Inbound network traffic for a deployment version |
| deployments.network_out | bytes (int) | Outbound network traffic for a deployment version |
| deployments.instance_start_time | seconds (float) | Average duration from instance creation to start time |
Default pipeline metrics
| Metric[^1] | Unit | Description |
|---|---|---|
| pipelines.requests | requests (int) | Number of requests made to the object |
| pipelines.failed_requests | requests (int) | Number of failed requests made to the object |
| pipelines.request_duration | seconds (float) | Average time in seconds for a pipeline request to complete |
| pipelines.input_volume | bytes (int) | Volume of incoming data in bytes |
| pipelines.output_volume | bytes (int) | Volume of outgoing data in bytes |
| pipelines.object_requests | requests (int) | Number of requests made to deployments in a pipeline |
| pipelines.object_failed_requests | requests (int) | Number of failed requests made to deployments in a pipeline |
[^1] Deployment and pipeline metrics are sampled every 60s [^2] credits is the amount of credits used by the active instance. The ratio will be different based on the instance type. [^3] If your deployment version is not showing the queue_time metrics it may be needed to re-upload your deployment package to start making use of this feature.
Token and user specific metrics
It is possible to see metrics which are generated by a specific user or a service user (API token). To view this data, go to the Monitoring page, click Add object and select for what user or service user you want to view the data.
Custom metrics
It is possible to create and track custom metrics in UbiOps as well. This is especially helpful for tracking model specific metrics like accuracy or precision.
Defining a new custom metric
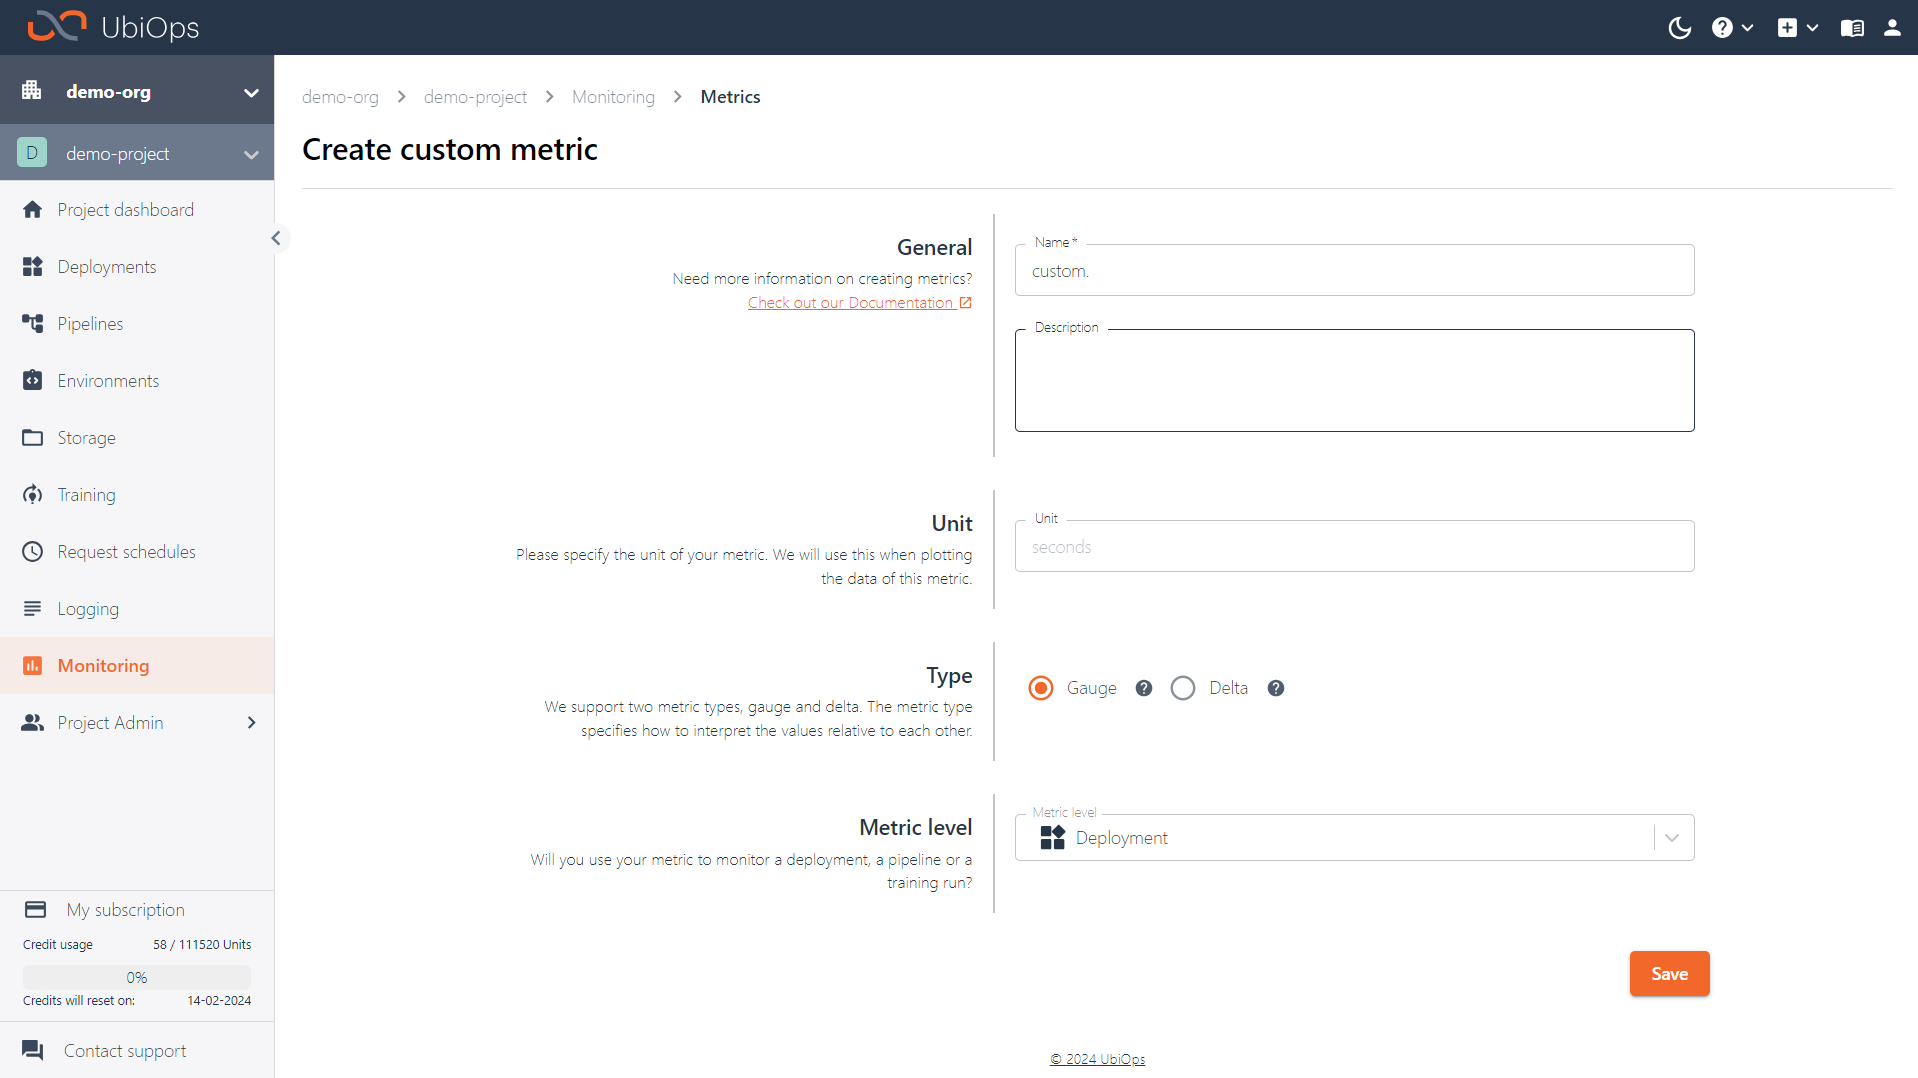
To start tracking a new custom metric, it first needs to be defined in UbiOps. You can do so by navigating to Monitoring > Metrics > Create custom metric in the WebApp. To create a new custom metric you can configure the following fields:
- Name: the name of your custom metric. It always has to begin with
custom.. This is the name that will be used for the titles of associated graphs later - Description (optional): the description of your custom metric.
- Unit (optional): the unit of measurement for your custom metric (e.g. seconds)
- Metric type: how this metric should be processed. We support Gauge and Delta metrics. For a gauge metric, the value measures a specific instant in time. For example, metrics measuring CPU utilization are gauge metrics; each point records the CPU utilization at the time of measurement. For a delta metric, the value measures the change in a time interval. For example, metrics measuring request counts are delta metrics; each value records how many requests were received after the start time, up to and including the end time.
- Metric level (referred to as
labelsin the API): on what level do you plan to store the metric? In the WebApp you can select either deployment level, pipeline level, or training run.
Custom metric labels
If you do not intend to tie your custom metric to deployments, pipelines or training runs, it is also possible to pass different labels. This can only be done when working with the client library or API directly.
Logging data to your custom metric
You can easily log data to your custom metric with the UbiOps Python Client Library. You just need to add ubiops as a dependency to your environment. Then, you need to initialize and start a MetricClient instance, and log values with the log_metric function.
from ubiops.utils.metrics import MetricClient


# Start the metric client
metric_client = MetricClient(project_name = "your_project_name")
metric_client.start()

# Log the metric
metric_client.log_metric(
  metric_name = "custom.your_metric_name",
  labels = {"deployment_version_id": "your_deployment_version_id"}, # Can also be a pipeline_version_id, deployment_request_id
  value = your_metric_value
)

# Flush all metrics
metric_client.stop()
Typically, you'll want to log metrics from within a training run, a deployment, or pipeline. Below you can find example code snippets for each case. Each code snippet assumes that you have already defined the custom metric beforehand, as described in the previous section.
from ubiops.utils.metrics import MetricClient

def train(training_data, parameters, context):
    training_run_id = context["id"]
    project_name = context["project"]
    metric_client = MetricClient(project_name=project_name)
    metric_client.start()
    # <YOUR TRAINING CODE>

    example_value = 0
    metric_client.log_metric(
        metric_name = "custom.example", # Make sure you created a metric with this name beforehand
        labels = {"deployment_request_id": training_run_id},
        value = example_value
    )

    metric_client.stop()
from ubiops.utils.metrics import MetricClient

class Deployment:
    def __init__(self, base_directory, context):
        self.metric_client = MetricClient(project_name=context["project"])
        self.metric_client.start()
        self.context = context

    def request(self, data, context):
        example_value = 0
        self.metric_client.log_metric(
            metric_name = "custom.example", # Make sure you created a metric with this name beforehand
            labels = {"deployment_version_id": self.context["version_id"]},
            value = example_value
        )

    def stop(self):
        self.metric_client.stop()
from ubiops.utils.metrics import MetricClient

class Deployment:
    def __init__(self, base_directory, context):
        self.metric_client = MetricClient(project_name=context["project"])
        self.metric_client.start()
        self.context = context

    def request(self, data, context):
        example_value = 0
        if "pipeline_version_id" in context.keys():
            print("Deployment was called as part of a pipeline, logging metric on pipeline level.")
            self.metric_client.log_metric(
                metric_name = "custom.example", # Make sure you created a metric with this name beforehand
                labels = {"pipeline_version_id": context["pipeline_version_id"]},
                value = example_value
            )

    def stop(self):
        self.metric_client.stop()
A maximum of one value will be registered per minute
Metrics are aggregated per minute by the UbiOps API. If you log multiple values within a minute with the client library, the value logged for that minute will either be an average (if the metric is a Gauge metric), or a sum (if the metric is a Delta metric), of those values.
For step-by-step examples of working with training metrics, have a look at the following how-to's:
- Tracking custom metrics for your training run
- Tracking custom metrics for your deployment
- Tracking custom metrics for your pipeline
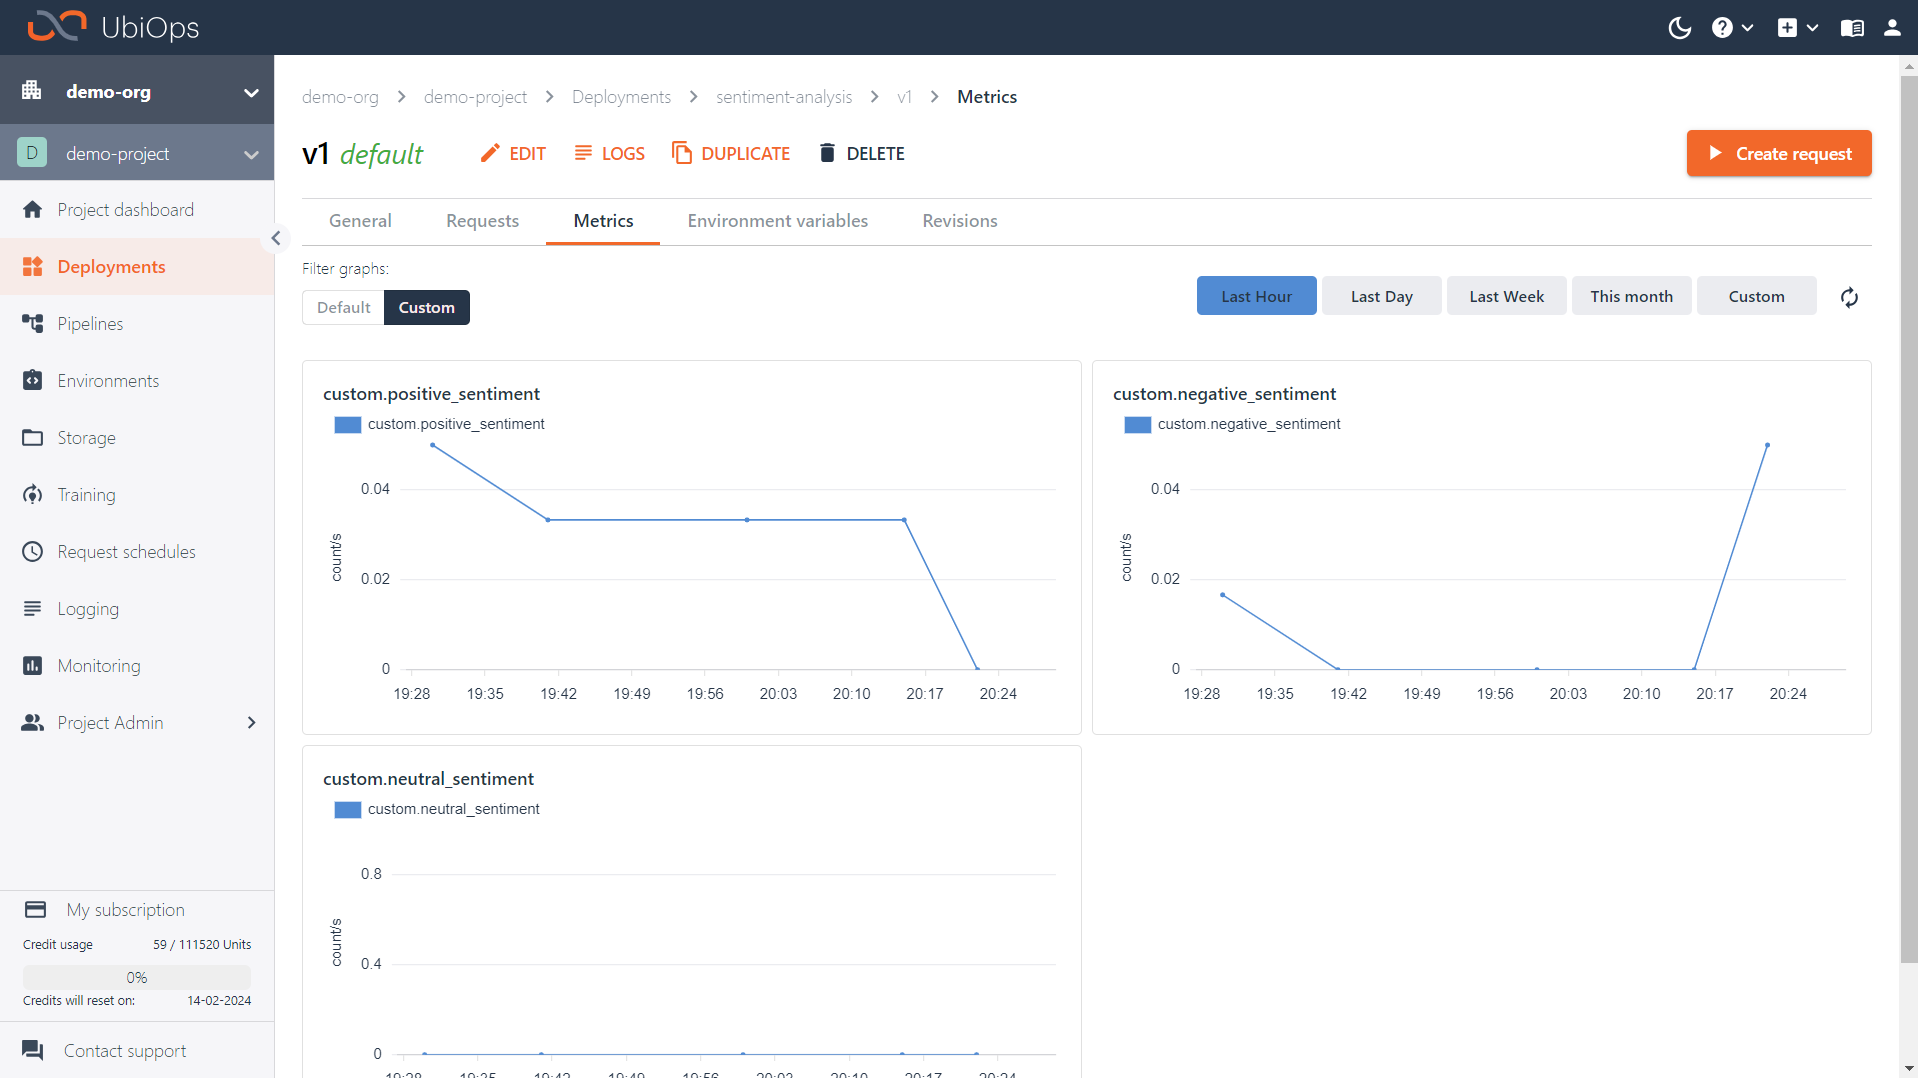
Viewing data of your custom metrics
You can view the data of your custom metrics in the WebApp. If you want to inspect your custom metrics for a specific object, you can navigate to the metrics tab of that object. In the case of deployments and pipelines you can find the tab on the version details page, for training runs you can find it on the training run details page. On these metrics tabs you will see a toggle with which you can toggle your view between default metrics and custom metrics for that object.
In case you want to view the data of multiple objects at once, you can also navigate to the general monitoring page (Monitoring > General). Here you can add objects to the view via the Add object button. You can customize this page to only show the graphs you are interested in. To add a graph, click the Add graph button and select the metrics you want to see (default or custom). To remove one, click on the three little dots in the top right of the graph and select Remove graph.
Getting data from the API
If you want to get the data for your metrics directly from the API, that's also possible. We will go over a few examples using the relevant Python Client API time_series_data_list endpoint. If you want to extract different metrics, you can adjust the metric parameter to the name of the metric you want to get data from. Available metric names are visible in the WebApp when navigating to Monitoring > Metrics, or by using the Python Client API metrics_list endpoint.
Below you can see an example of how to get the total credit rate (average credit usage per second) of your project during a specified time range. This sums the credit rate per second of all deployments and training experiments in your project.
import ubiops

# Set connection parameters
API_TOKEN = "Token xyz"
PROJECT_NAME = '<YOUR PROJECT NAME>'

# Connect to the UbiOps API
configuration = ubiops.Configuration()
configuration.api_key['Authorization'] = API_TOKEN
configuration.host = "https://api.ubiops.com/v2.1"
api_client = ubiops.ApiClient(configuration)
api = ubiops.CoreApi(api_client)

# Get the credit usage of all deployments in your project in intervals of a minute
deployments_credits_rate = api.time_series_data_list(
    project_name=PROJECT_NAME,
    metric="deployments.credits",
    start_date="2024-06-11 09:00:00.00", # Max time range of 1 day
    end_date="2024-06-12 09:00:00.00",
    aggregation_period = 60 # 1 minute
)
Note the usage of the aggregation_period parameter, which is set at 60. This parameter groups the metrics, returned as time series, in intervals of 60 seconds. Possible values for aggregation_period are 60, 300, 900, 3600, 7200, 21600 and 86400 (all expressed in seconds). These values correspond to grouping the metrics into intervals of a minute, five minutes, fifteen minutes, an hour, two hours, six hours and a day respectively. The intervals are aligned with full minutes, five minutes, ..., days, respectively, starting from the interval of the start_date parameter and ending at the interval of the end_date parameter. For example, with an aggregation_period of 3600 (one hour), the data will be aggregated into hourly intervals, each starting at the top of the hour (e.g., 00:00, 01:00, etc.). Similarly, with an aggregation_period of 86400 (one day), the data will be aggregated into daily intervals, each starting at midnight.
Each value of the aggregation_period has an associated maximum time window. The maximum time window specifies how far apart the start_date and end_date can be for the time window to be valid.
| Aggregation Period (seconds) | Maximum Time Window (seconds) | Maximum Time Window (days) |
|---|---|---|
| 60 | 86400 | 1 day |
| 300 | 604800 | 7 days |
| 900 | 2419200 | 28 days |
| 3600 | 7776000 | 90 days |
| 7200 | 15552000 | 180 days |
| 21600 | 31536000 | 365 days |
| 86400 | 31536000 | 365 days |
Let's say we are not interested in the credit rate, but rather in the absolute credit usage. To this end, we apply post-processing to the previous result, where we add a field absolute_value to the data_points attribute, whose value is a conversion from the request rate (per aggregation_period) to absolute values. This yields the total credit usage in the entire project during each interval.
# Convert the API response to dictionary for easier post-processing
deployments_credits_rate = deployments_credits_rate.to_dict()

# Add a field with the absolute value of requests per interval of a minute
for i, data_point in enumerate(deployments_credit["data_points"]):
    absolute_value = round(data_point["value"] * deployments_credits_rate["aggregation_period"])
    deployments_credits_rate["data_points"][i]["absolute_value"] = absolute_value
It is possible to add labels (for example deployment_version_id:id, user_id:id or pipeline_version:id) to get more granular data for certain deployment versions, pipeline versions, experiments or users. If you want to get data for a training experiment, you can pass the experiment ID to a deployment_version_id label.
Now let's get the average number of instances of a deployment version in intervals of an hour. To get any results, this metric requires a deployment_version_id label.
# Get the number of instances of a deployment in your project in intervals of an hour
instances_response = api.time_series_data_list(
    project_name=PROJECT_NAME,
    metric="deployments.instances",
    start_date="2024-06-05 00:00:00.00",
    end_date="2024-06-12 09:00:19.65", # Max time range of 90 days
    aggregation_period = 3600, # 1 hour
    labels = "deployment_version_id:51aa4097-ae80-4da7-8dbd-d71a36821444"
)
Lastly, we apply an additional user_id filter to the pipelines.requests metric, with an aggregation_period of a day. We then get the average pipeline request rates per second during that day, made by a service user to a pipeline version.
# Get the request rate of a service user to a pipeline version in intervals of an hour
pipelines_requests_rate_response = api.time_series_data_list(
    project_name=PROJECT_NAME,
    metric="pipelines.requests",
    start_date="2024-06-05 00:00:00.00",
    end_date="2024-06-13 09:00:19.65", # Max time range of 365 days
    aggregation_period = 86400, # 1 day
    labels="pipeline_version_id:9fee5c2e-989e-49dc-b83b-945c3273b5a2,user_id:0344dbb1-5001-4a49-9141-7293ff36eeba"
)
Note that it is only possible to get user-specific details in combination with either specifying a pipeline_version_id or deployment_version_id. To get the total number of requests of a user on the project-level, you will need to loop over all the experiments and deployment versions.