Logging
UbiOps captures logs created by deployments and pipelines and organizes them such that they can be accessed easily.

The recommended way to access the logs is through the WebApp (available at https://app.ubiops.com for our SaaS solution). It is also possible to access the logs via CLI or Client libraries, see Interfacing with UbiOps.
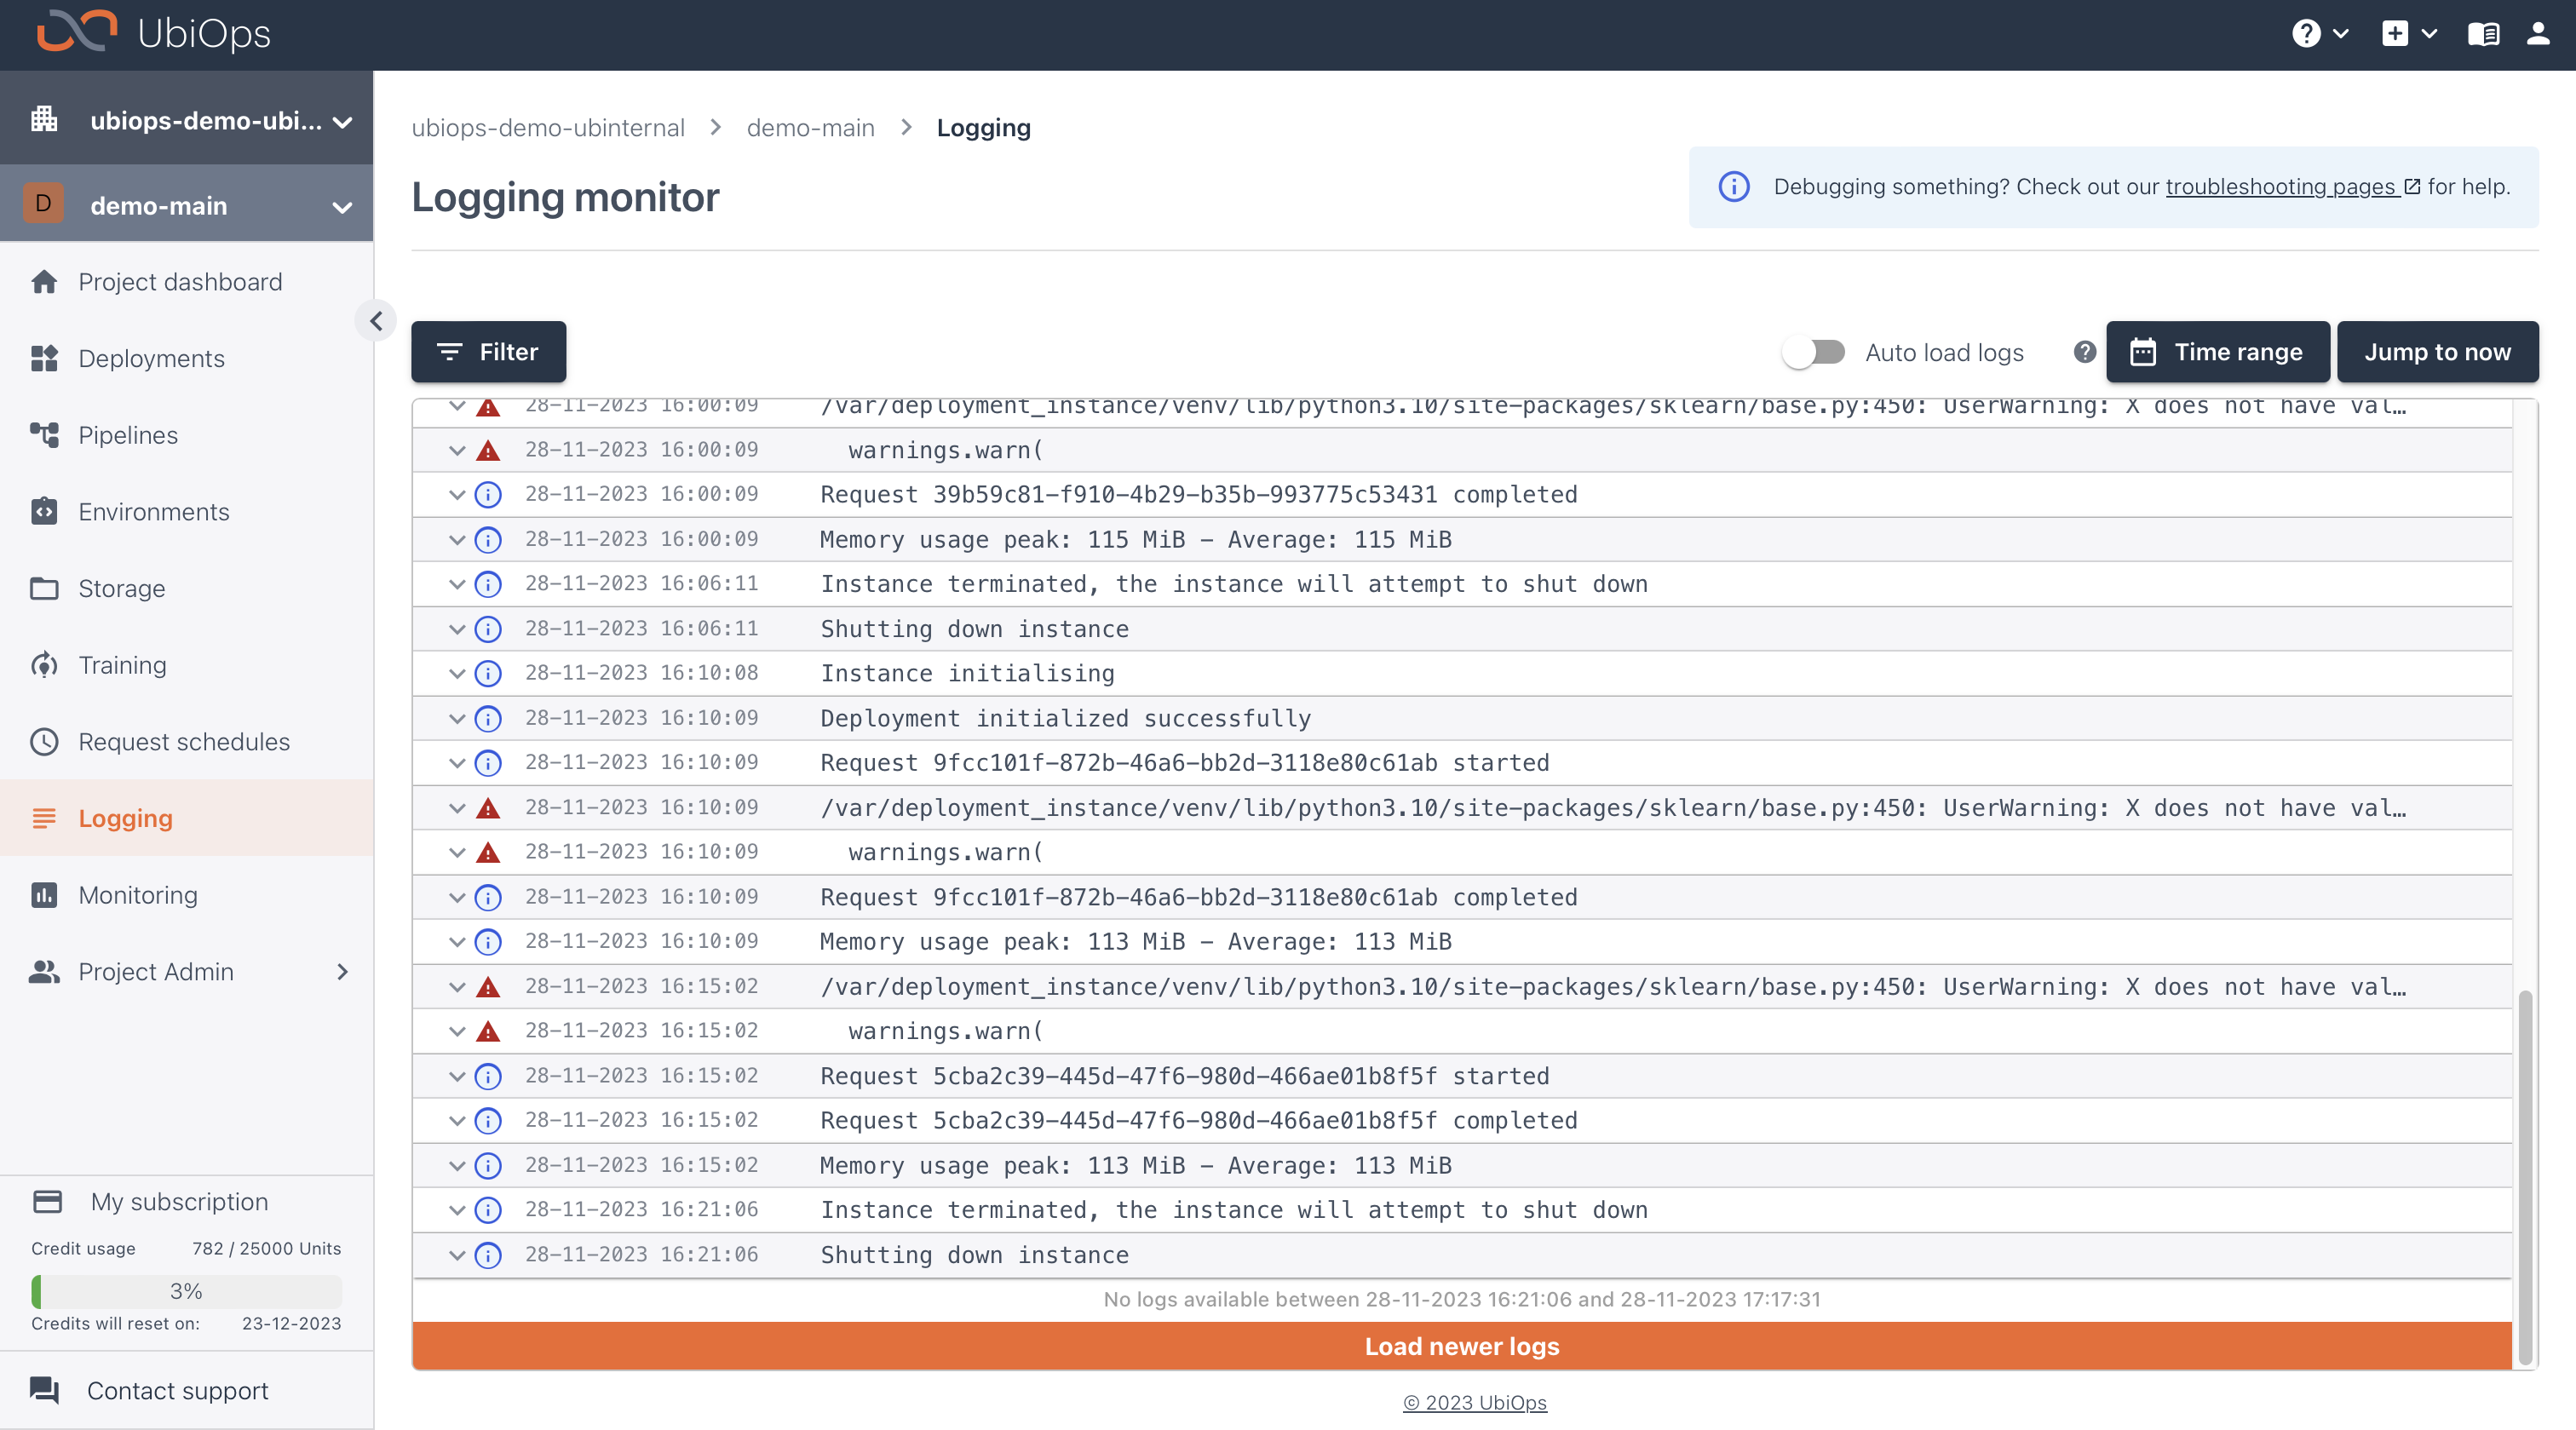
Logs can be found under Logging in the left navigation panel. This will show a list of recent log lines. By default, UbiOps saves the logs for 7 days. If you need longer log retention, please contact us via our support portal. It is possible to filter logs on date, or on properties like pipeline_name.
Most objects in UbiOps (like deployments, pipelines, requests and builds) have a LOGS button which redirects to the logging page and automatically applies a filter for the relevant object. These filters can also be applied manually.
Log levels
UbiOps supports different log levels: info and error. Logs printed with, for example, print, logging.debug, logging.info and logging.warning are marked with level=info. While, logs printed with logging.error and exceptions are marked with level=error.
The level of the logs are visible in UbiOps WebApp and it is possible to filter on the level.
System logs
UbiOps distinguishes system level and user level logs from one another by means of a system flag. System logs are logs that are generated by UbiOps. User level logs are logs that are generated by your code. You can filter on the different types of logs by setting the system filter to either true or false.
Purpose of logs
The logs are your primary source of information for debugging if something goes wrong. Anything that is outputted by the code of your deployments can be found in the logs. So if something goes wrong in your deployment code, the error stacktrace can be found in the logs. If you need help with debugging, please take a look at the troubleshooting section.
Logs are also helpful for knowing what is happening in the background, for instance when your deployment is building. You might have noticed that when you create a new deployment version, and you go to the version details page, you will see a button called build logs. If you click on this button you can see all the logs related to the building process of your deployment.