Introduction to Monitoring
UbiOps has the following features to monitor your models.
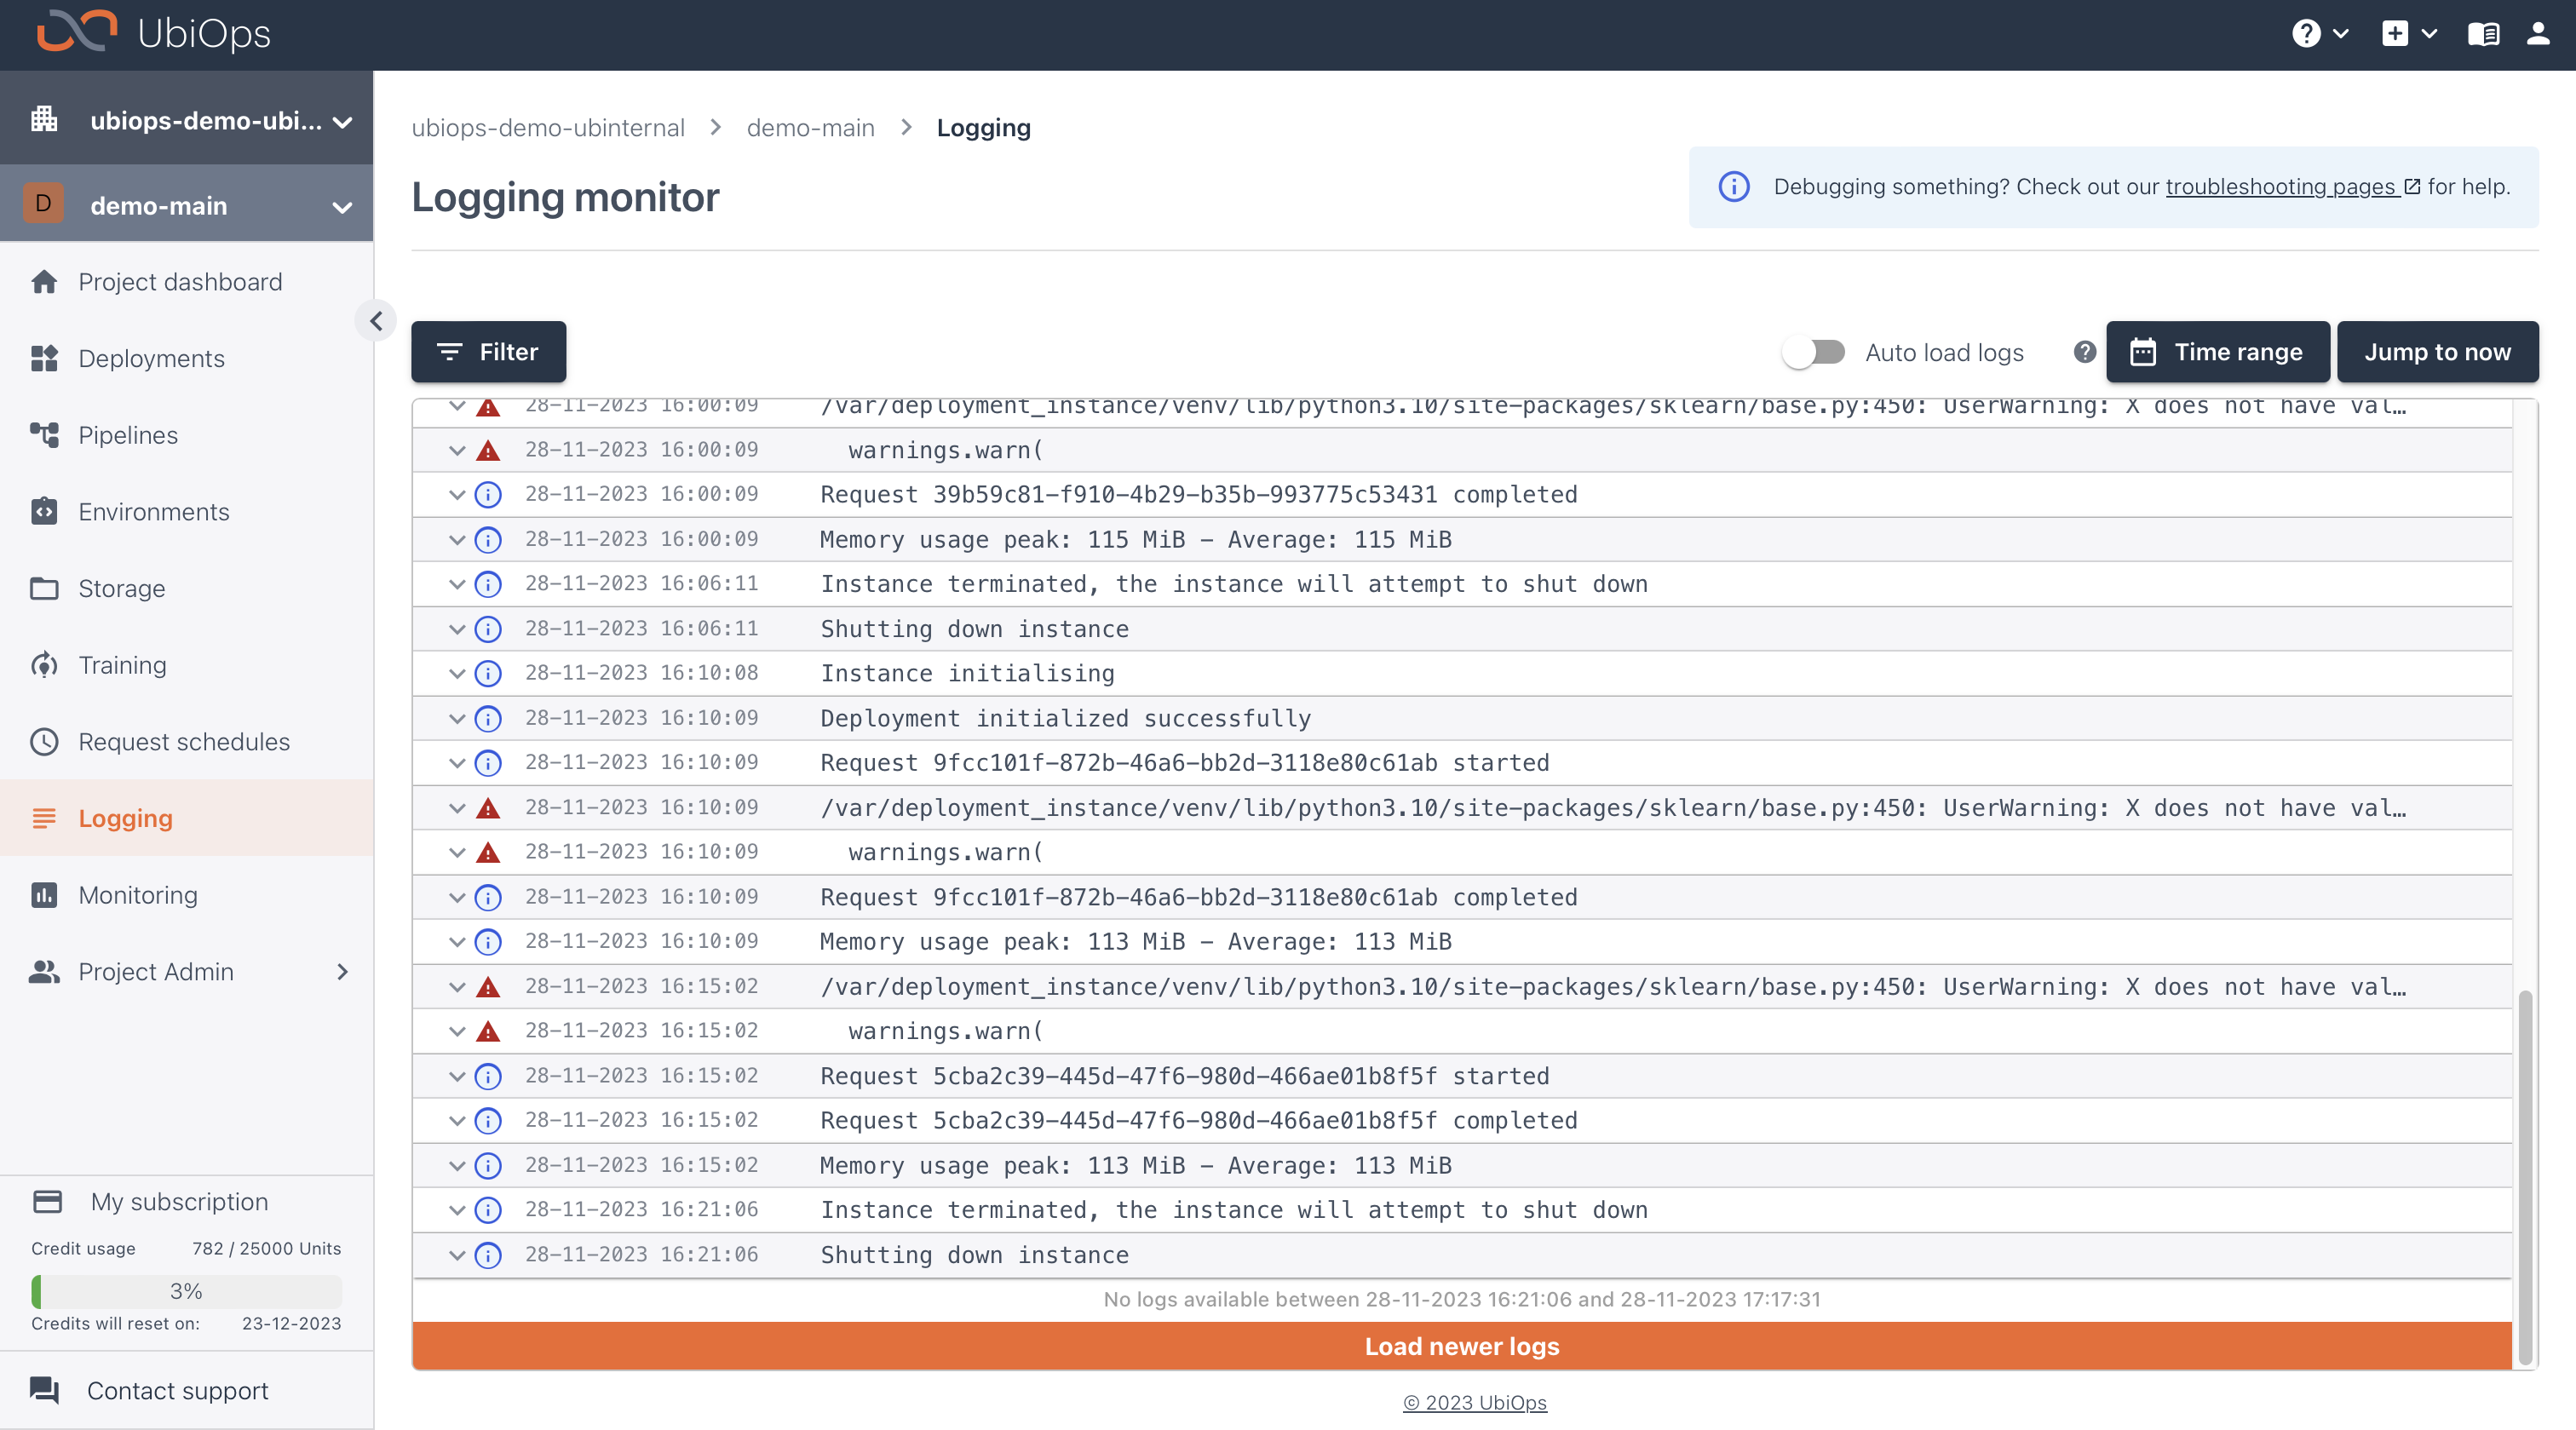
Logging
All the logs that are created by deployments, pipelines and training runs can be found on the Logging page. You can find specific logs for deployments and pipelines by clicking their LOGS button, or by using the filter system on the Logging page.
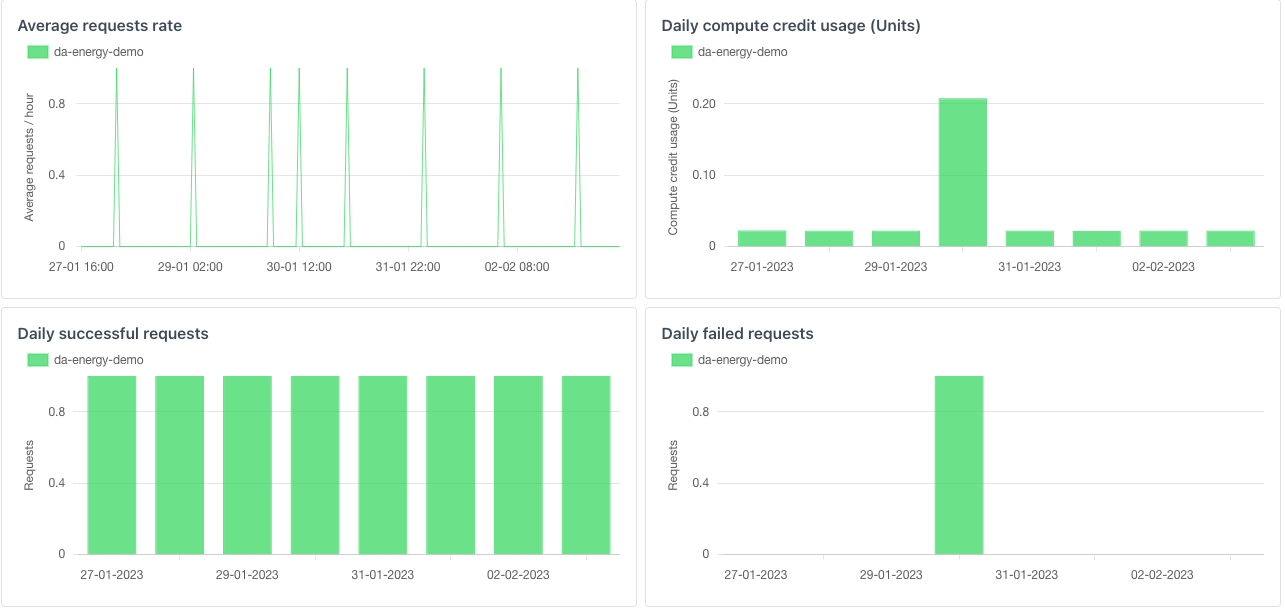
Metrics & request overview
Metrics and Requests can be found under Monitoring in the left navigation panel. This will show an overview of project level metrics and requests. It is possible to filter metrics on date, or on properties like deployment_name. You can also create custom metrics for your deployment, pipeline, or training run.
Active instances
To handle all the incoming requests, UbiOps will orchestrate instances of your deployment versions. They are continuously being scaled up and down to cover the traffic to the deployments. When a request's status changes from pending to processing, this means that the request has been picked up by an instance. For each deployment version you can inspect all the currently active instances. To see all the currently active instances in the entire project, navigate to Monitoring > Active instances. You can also get this information directly from the API or with the client library. Below you can find an example code snippet for retrieving this info from the client library.
import ubiops

PROJECT_NAME = 'example-project'
API_TOKEN = 'token 123'

configuration = ubiops.Configuration()
configuration.api_key['Authorization'] = API_TOKEN
client = ubiops.ApiClient(configuration)
api = ubiops.CoreApi(client)

# Retrieving active instances on project level
active_instances = api.project_instances_list(project_name = PROJECT_NAME)

# Retrieving active instances for a specific deployment version
active_instances_depl = api.instances_list(project_name = PROJECT_NAME, deployment_name = 'example', version='v1')

Webhooks
Webhooks enable you to listen for events in your project, so you can automatically trigger follow-up actions in the rest of your stack. or example, you can trigger an internal service when a deployment finishes a request, or you can automatically notify your team members through Slack, Teams or other notification channels, each time a deployment or pipeline request fails.
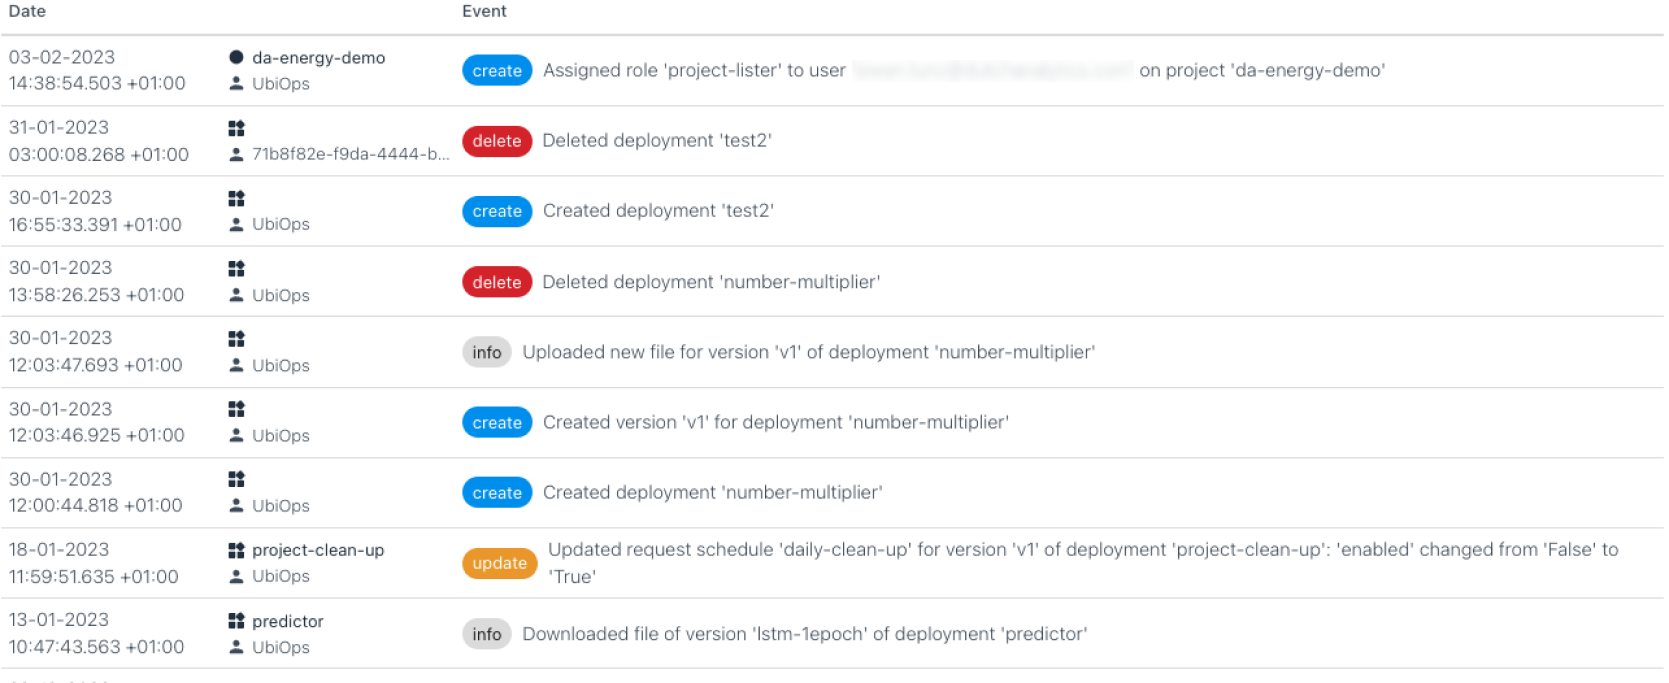
Audit events
UbiOps provides four ways in which you can check your activities. The Audit events shows your activity on project level. Here you can get information about the deployments and pipelines in your currently selected project. For deployments, you can get information about when you created a deployment, updated it by uploading a new revision for a specific version or deleted a deployment (version). You get the same information for pipelines.
Audit Event Limitations
The creation of direct and batch requests are not stored as an Audit event, as are file up- and downloads to/from your bucket(s).
Notifications
You can enable Notifications by configuring one or more email addresses on a deployment or pipeline version. The notification will inform you about the requests that are made to your deployment and pipelines.