Tracking training metrics on UbiOps
When you're training a new model on UbiOps, you might want to track some metrics as you go. This how-to covers how-to track accuracy when running Tensorflow or PyTorch training code on UbiOps. We will cover the 2 necessary steps:
- Define a new metric in UbiOps
- Adjust your training code to log datapoints for this metric.
Defining a new metric in UbiOps
Before you can track any custom metric in UbiOps, the metric needs to be defined. You can either do this in the WebApp by navigating to Monitoring > Metrics > Create new metric, or via code. Let's walk through both.
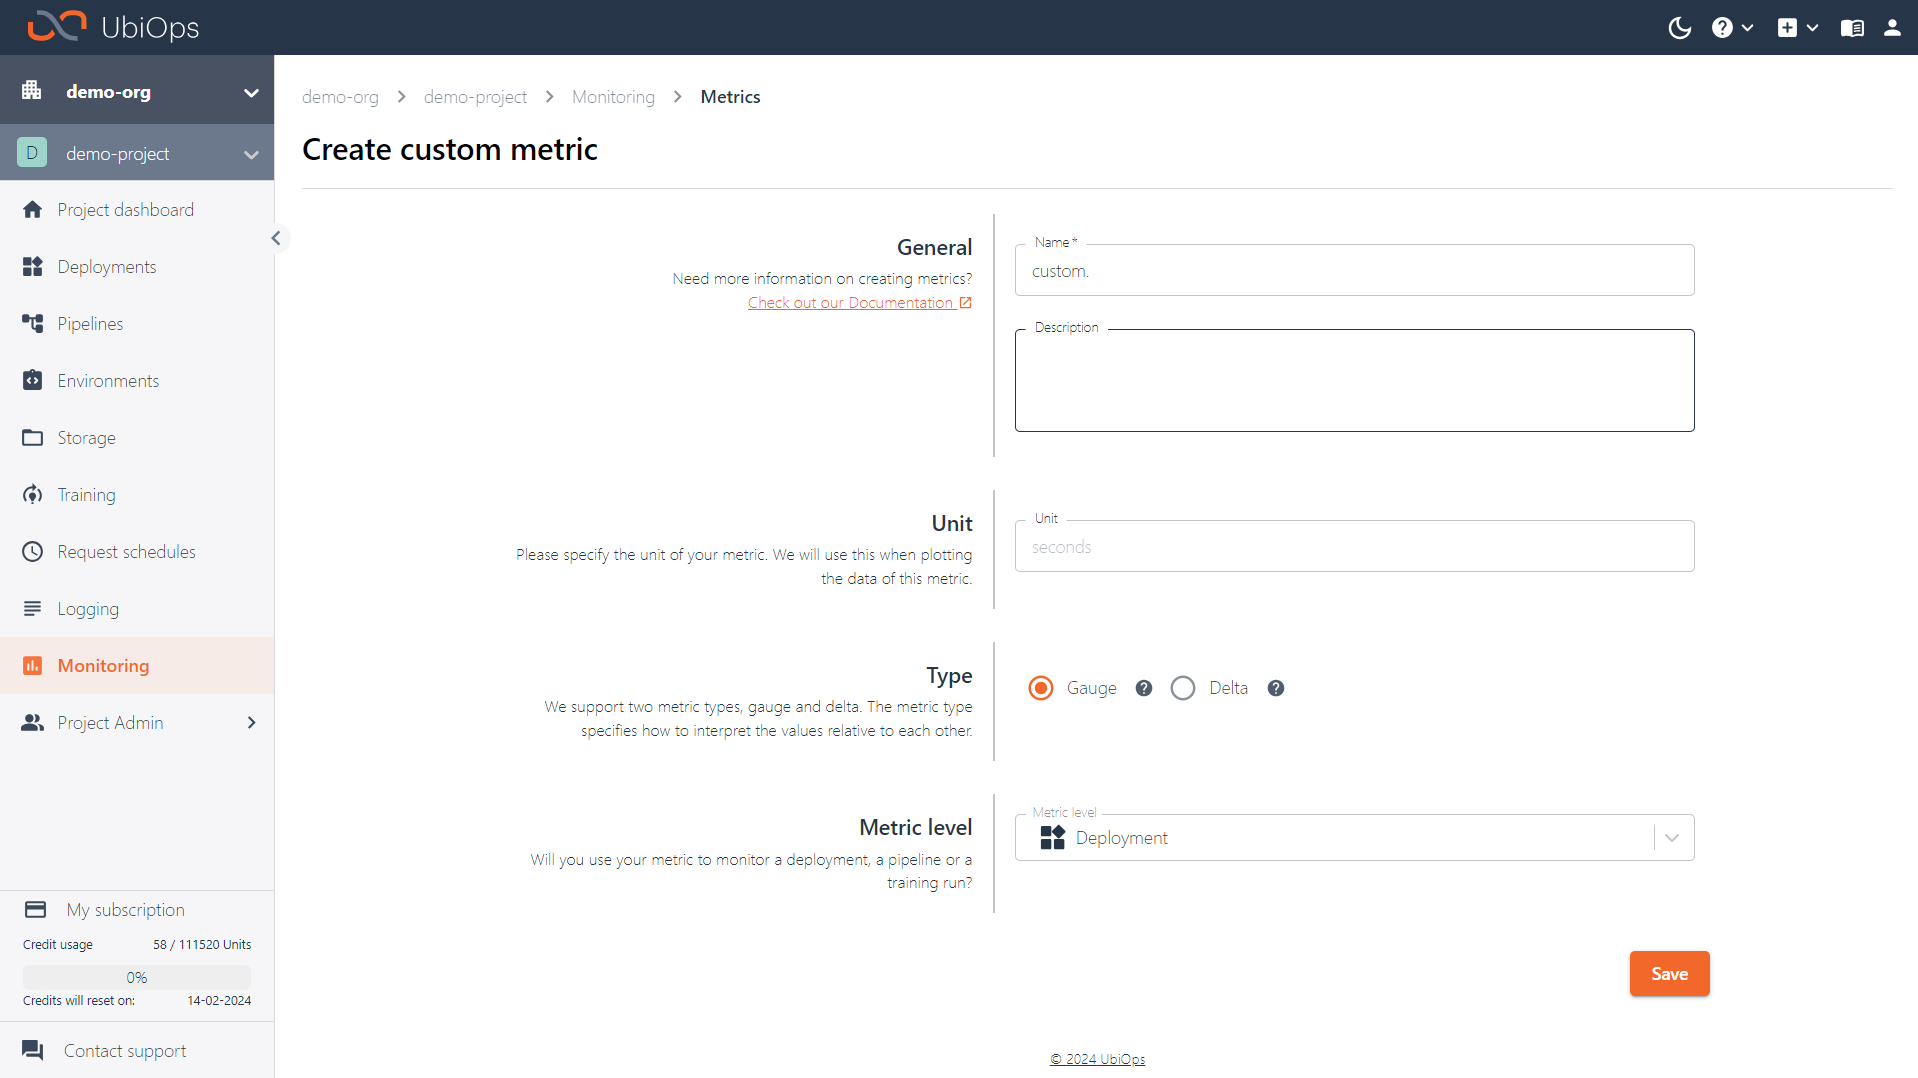
When you click Create new custom metric in the WebApp, you will be redirected to a form where you need to provide the following information:
- Name: the name of your custom metric. It always has to begin with
custom.. This is the name that will be used for the titles of associated graphs later. In our example we can call our metriccustom.accuracy - Description (optional): the description of your custom metric.
- Unit (optional): the unit of measurement for your custom metric In our case we can use
%. - Metric type: how this metric should be processed. We support Gauge and Delta metrics (see metrics for more details). For our example we can use Gauge.
- Metric level (referred to as
labelsin the API): on what level do you plan to store the metric? In our case we need the metric on training run level.
When you click Create the metric will be created, and you can start logging data to it. Alternatively, you can also do the same with the Python client library:
import ubiops

configuration = ubiops.Configuration()
# Configure API token authorization
configuration.api_key['Authorization'] = "Token <YOUR_API_TOKEN>"
api_client = ubiops.ApiClient(configuration)
core_api = ubiops.CoreApi(api_client)

project_name = 'project_name_example' # str
data = ubiops.MetricCreate(
    name = 'custom.accuracy',
    description = 'Accuracy of my model',
    metric_type = 'gauge',
    unit = '%',
    labels = ['deployment_request_id']
)

# Create the metric
api_response = core_api.metrics_create(project_name, data)
print(api_response)
Custom metric labels
If you do not intend to tie your custom metric to deployments, pipelines or training runs, it is also possible to pass different labels. This can only be done when working with the client library or API directly.
Logging datapoints from your training code
Now that the metric has been created in UbiOps, we can start logging data to it from our training code. You just need to start up a UbiOps metric client, and use its log_metric function.
from ubiops.utils.metrics import MetricClient


# Start the metric client
metric_client = MetricClient(project_name = "your_project_name")
metric_client.start()

# Log the metric
metric_client.log_metric(
    metric_name = "custom.accuracy",
    labels = {"deployment_request_id": "your_run_id"},
    value = your_metric_value
)

# Flush all metrics
metric_client.stop()
Let's have a look at how this would work with Tensorflow and PyTorch code specifically.
Tensorflow example
In order to log the accuracy after each epoch, the callbacks argument of the model.fit function can be used. In case you want to track the accuracy at a different interval, i.e. after each batch, you can modify one of the other predefined callback function. Have a look at the Tensorfllow callbacks documentation for more details about working with Tensorflow callbacks.
import tensorflow as tf
from ubiops.utils.metrics import MetricClient


class UbiOpsCallback(tf.keras.callbacks.Callback):
    def __init__(self, metric_client):
        super().__init__()
        self.metric_client = metric_client
        self.metric_client.start()

    def on_epoch_end(self, epoch, logs=None):
        """
        This function is called at the end of each epoch.

        :param epoch: the epoch number
        :param logs: the logs of the epoch
        """
        accuracy = logs["accuracy"] * 100 # convert to percentage
        self.metric_client.log_metric(metric_name="custom.accuracy", labels={"deployment_request_id": self.context["id"]}, value=accuracy)


def train(training_data, parameters, context):
    """
    This function is called by UbiOps.

    :param training_data: the training data
    :param parameters: the parameters
    :param context: the context
    """

    project_name = context["project"]
    metric_client = MetricClient(project_name=project_name)

    # TODO: Add TensorFlow training code
    model.fit(
        training_data,
        callbacks=[UbiOpsCallback(metric_client)]
    )

    # Flush all metrics
    metric_client.stop()
PyTorch example
When we want to log our accuracy at the end of every epoch with PyTorch, we can simply call the log_metric function within the training loop.
import torch
from ubiops.utils.metrics import MetricClient

def train(training_data, parameters, context):
    """
    This function is called by UbiOps.

    :param training_data: the training data
    :param parameters: the parameters
    :param context: the context
    """
    project_name = context["project"]

    metric_client = MetricClient(project_name=project_name)
    metric_client.start()

    # TODO: Add PyTorch training code

    for epoch in range(epochs):
        # TODO: Add training code
        # TODO: calculate your accuracy

        metric_client.log_metric(metric_name="custom.accuracy", labels={"deployment_request_id": context["id"]}, value=accuracy)

    # Flush all metrics
    metric_client.stop()
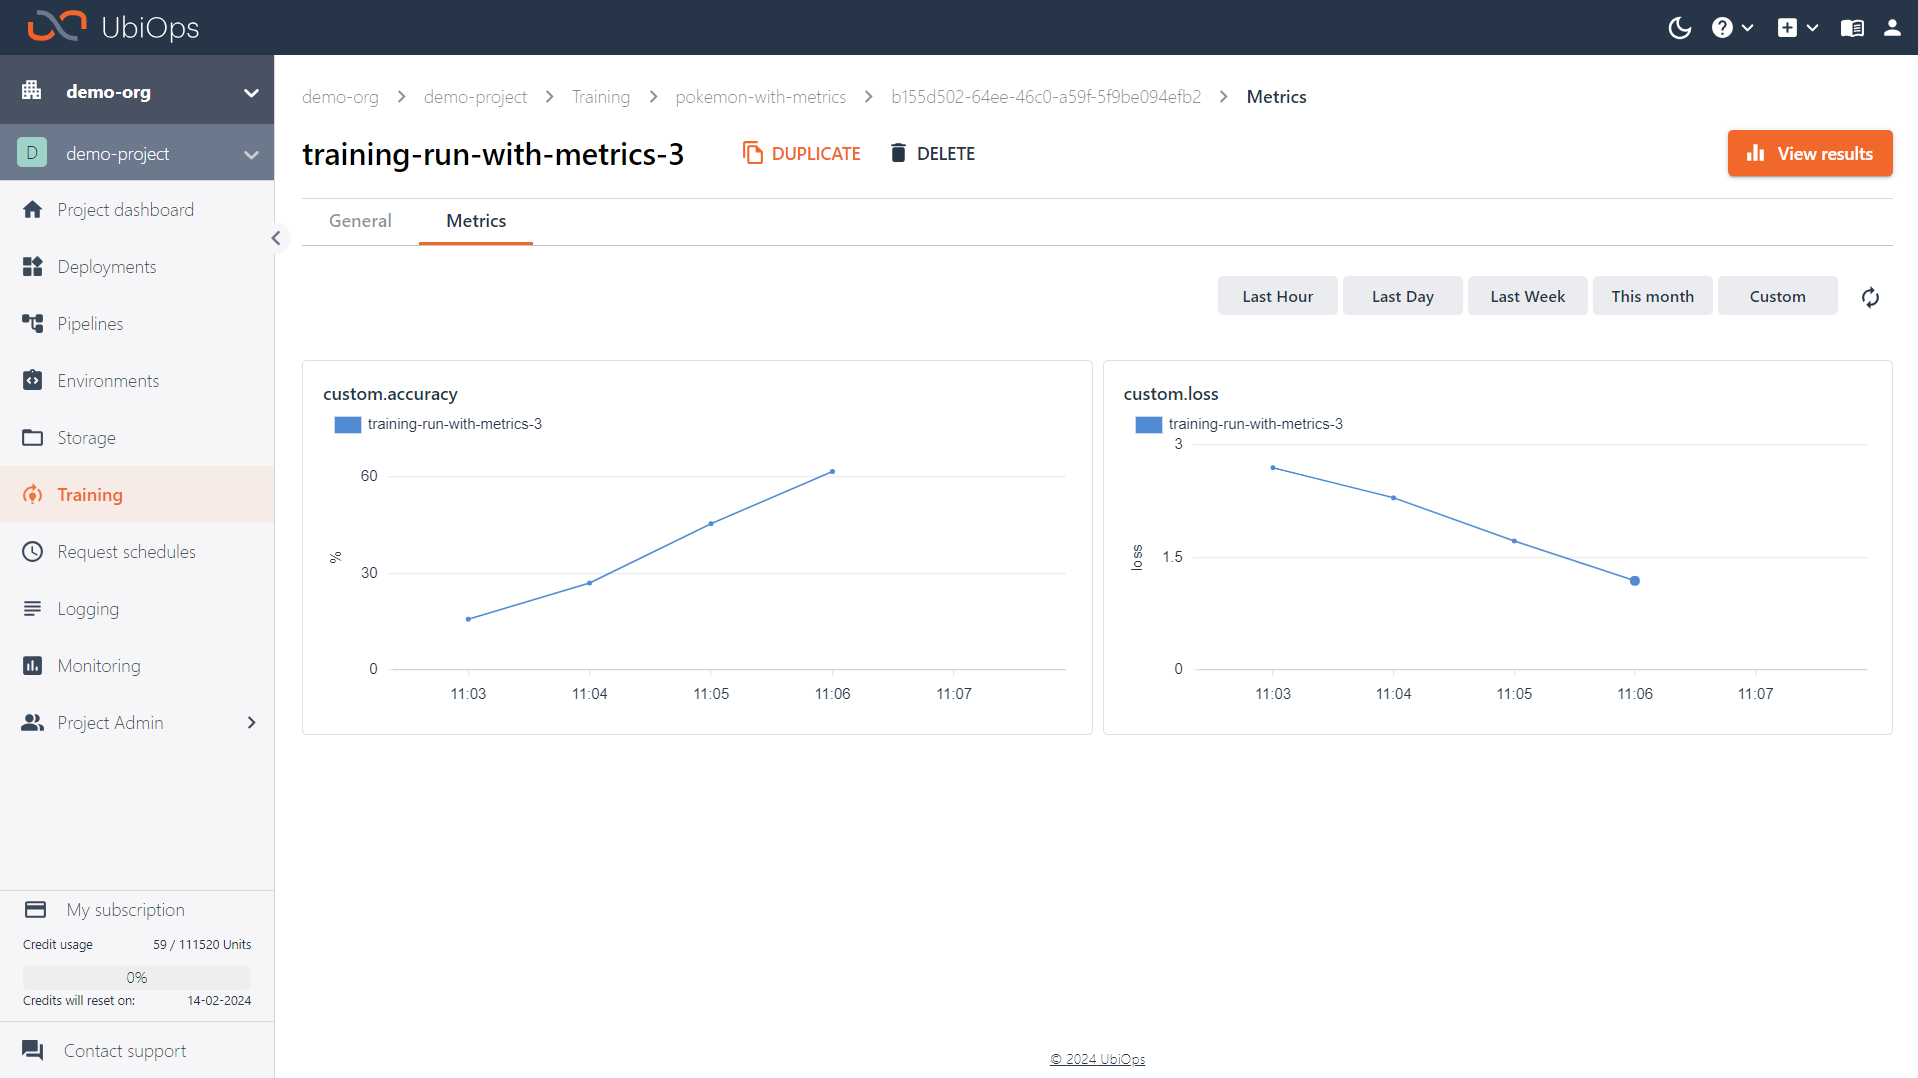
Viewing your data
When you define your metric and adjust your code to track it as defined in the previous steps, you will be able to see your custom metric data in the UbiOps WebApp. Simply navigate to your training run details page and click on the Metrics tab. The graph in the WebApp will have a resolution of maximum one value per minute and the graph will be updated real time as your training run is processing.